
Do you own or run an online business? Who is your search competition?
When you think of competition, the first names that will come to mind are those of companies that respond, through the products or services they offer, to the same needs for which you offer solutions. But if your traditional competition doesn’t compete for the same keywords as your site, you don’t have much to share in the search. In other words, it takes more work to identify who you are fighting with for organic traffic.
And why is it essential to know who your search competition is?
In online, search engines are the ones that decide which sites get more organic traffic, not users. You may have the most relevant business for a particular search, but if the optimization of your site is not ok, they will not rank you properly. You will lose, therefore, potential customers who, in the absence of loyalty, will serve without thinking about what another player in your category has prepared for them.
Knowing who you really share the online battlefield with means, above all, understanding what the strategies of all competitors are. For this, you can use Google Search manually and, for a fee and with a minimum of know-how, of tools that everyone knows – SEMrush, Searchmetrics, STAT.
But none of these time-consuming solutions show you with a click and a scroll what is the complete landscape of your digital competition on organic searches in Romanian. Moreover, no tool in the world shows you how Google sees the SEO & content optimization efforts of each player at the category level.
That’s why we’re here. Find out how you can see in 3 movements who obstructs your visibility in search
There are over 5 million searches in Romanian on Google every day, which we analyze in this report. As an online business, not responding to those for which you have expertise, means that you turn your back on a significant volume of users interested in what you know and offer.
To show brands where they are needed but absent, we translated their ability to respond to non-brand organic searches into a visibility score. Under it we have organized the whole list of keywords that users actively search for when they need to get in touch with a certain industry or category.
This is how we concretized Visibility Report, the tool that shows you which are the most visible sites in Romania in those digital categories where there is serious competition. And because we genuinely want to help brands make better, data-driven business decisions, we decided that this tool would be free.
In the following, we also tell you how you can use it to get the most valuable insights.
How the Visibility Report works and what strategic information it can give you month by month
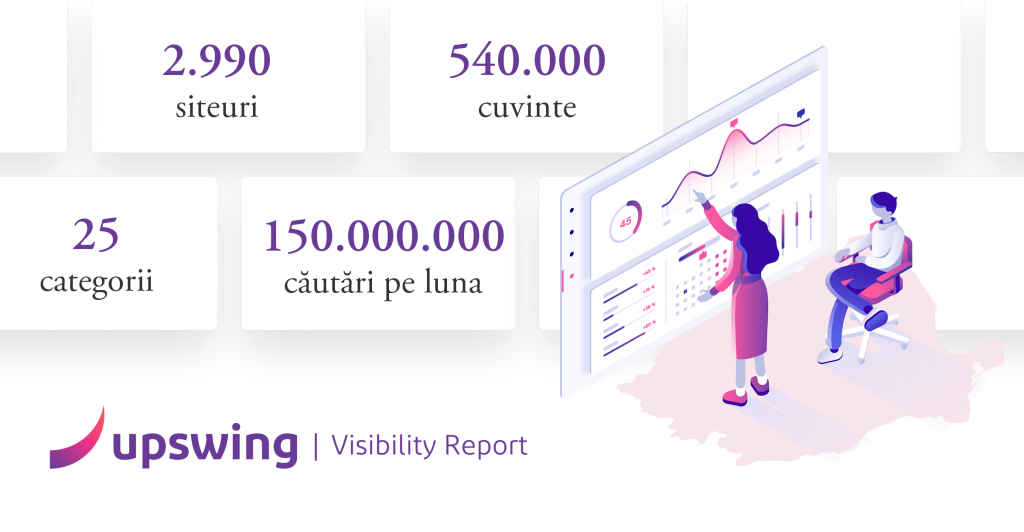
Visibility Report interprets data from 24 categories, analyzes 2,200 websites and tracks the results of over 540,000 keywords relevant to these categories. And it does it month by month, gathering historical data. Why ?, you ask.
- To save you important research and contextualization time and make your search performance mapping process easier
- To estimate the size of the market, or to accurately know the number of people searching for keywords in a given category each month
- To help you draw a parallel between traffic and profit
- To compare competitors who offer similar products and services
- To highlight the subjects that change the dynamics in the industry
- To show you the behind the searches intent that help you find out where customers’ needs are going
In other words, there is a good chance of becoming addicted to Visibility Report if you are a business owner, digital specialist or marketing manager. Once in the hands of those who need to be used to decline business strategies, this tool helps brands increase their search notoriety on relevant queries. This comes with optimizing time and budgets in the process of identifying opportunities.
See below what data the Visibility Report gives you and how it saves you time.
1. Find out the real size of the market in which your business operates
The traditional research process when it comes to keywords relates to a very large extent to the main keywords. This means that the general trend is to omit long tail words and specific informational searches, which could be targeted in content marketing articles.
For Visibility Report we automated the process as follows: it crawls on a volume of 3-5 reference sites for industry / category, to identify those keywords on which they rank. The words that these sites have in common become the words of the industry, easily omitted in a regular keyword research.
Access the page of an industry and in the upper right corner of it you will find these keywords, but also the volume of searches that correspond to them. For example, in the Eyewear industry there are 1,300 relevant keywords, with a volume of 190,000 searches per month.

2. See who are the most visible players in your category
The temptation to take as a benchmark brands with offline notoriety or those with impressive turnovers is great, but online things are different. For example, you might be tempted to think that the sites in the first places after the “sunglasses” and “eyeglasses” searches are the most visible, but the truth is that, in addition to these general searches, there are also many specific searches, which include the consumer’s gender, favorite brand or other such attributes.
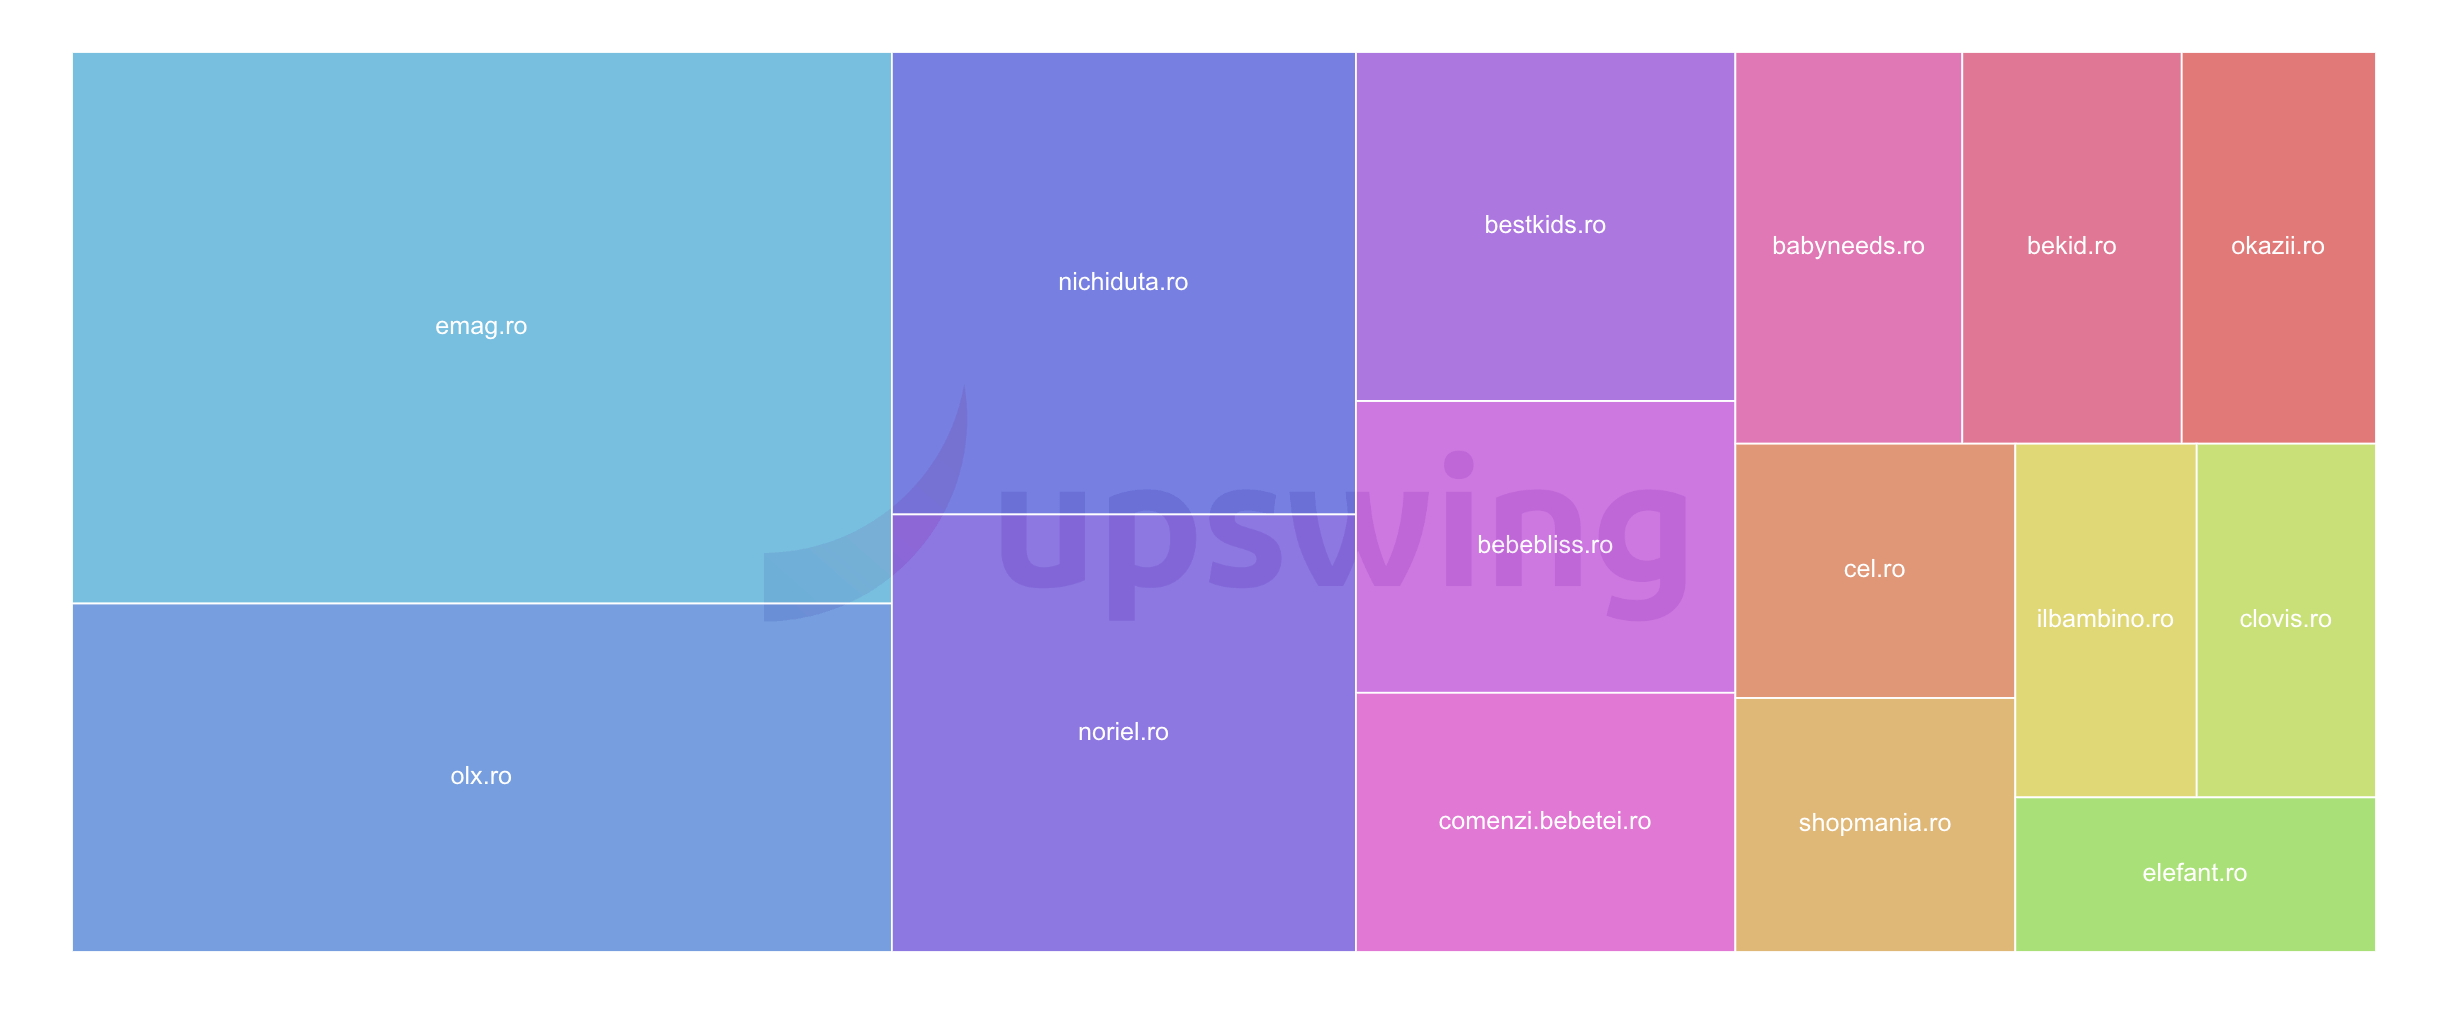
These specific searches upset the offline hierarchy, and the report will give you a clearer picture of the players with the best online visibility. The results can be surprising – Lensa is placed above some well-known eyewear brands offline (such as Optiplaza or Optiblu), but Emag or OLX are also proving to be more valuable on products for children than niche sites such as Noriel or Best Kids .
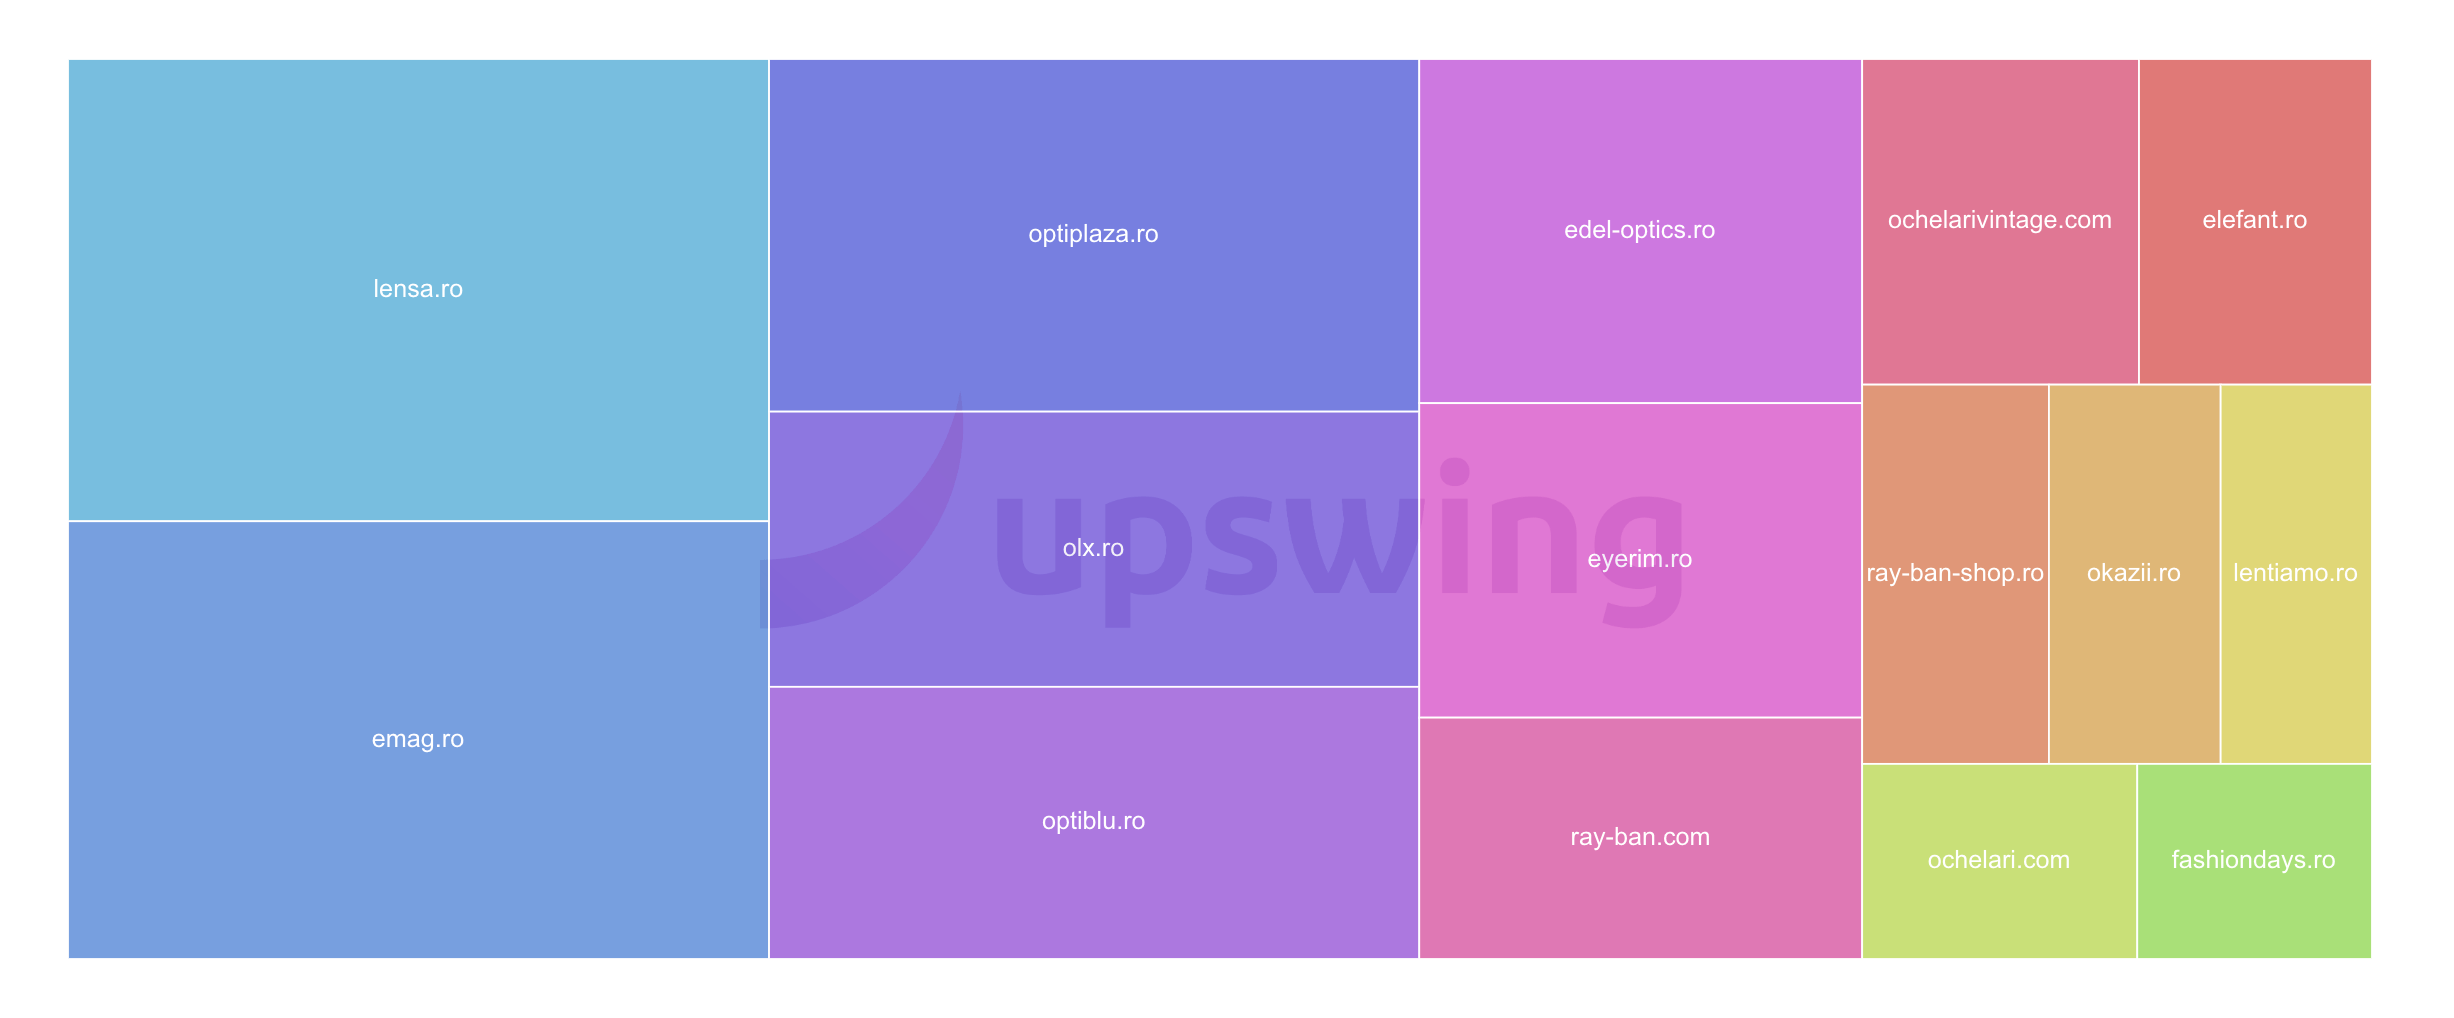
This means that the overall image of the industry is not exactly predictable and the visibility is the one according to which a brand is positioned compared to its competitors. To figure out which players to fear, access the industry you belong to and visually “scan” competing brands; the higher their visibility, the larger their space in the graphic tree map.
3. See exactly where you stand compared to your competitors
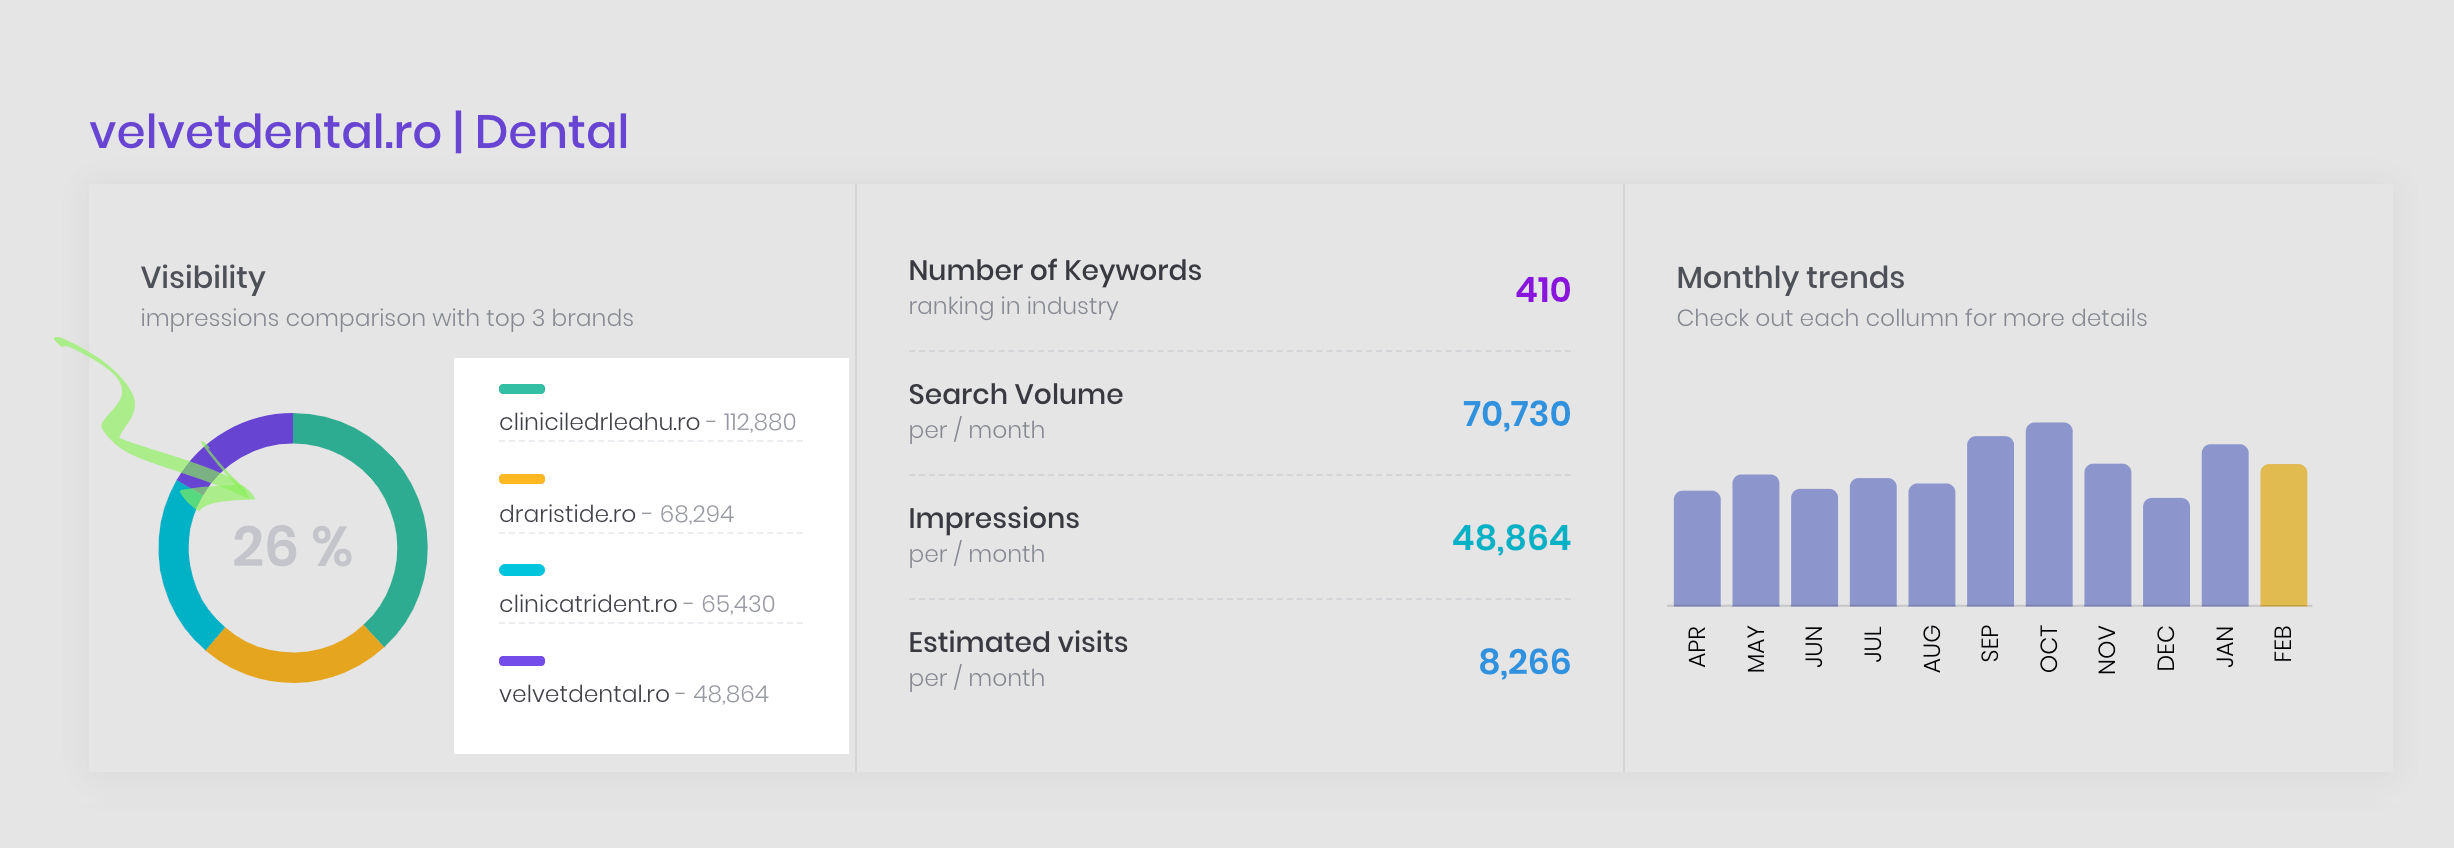
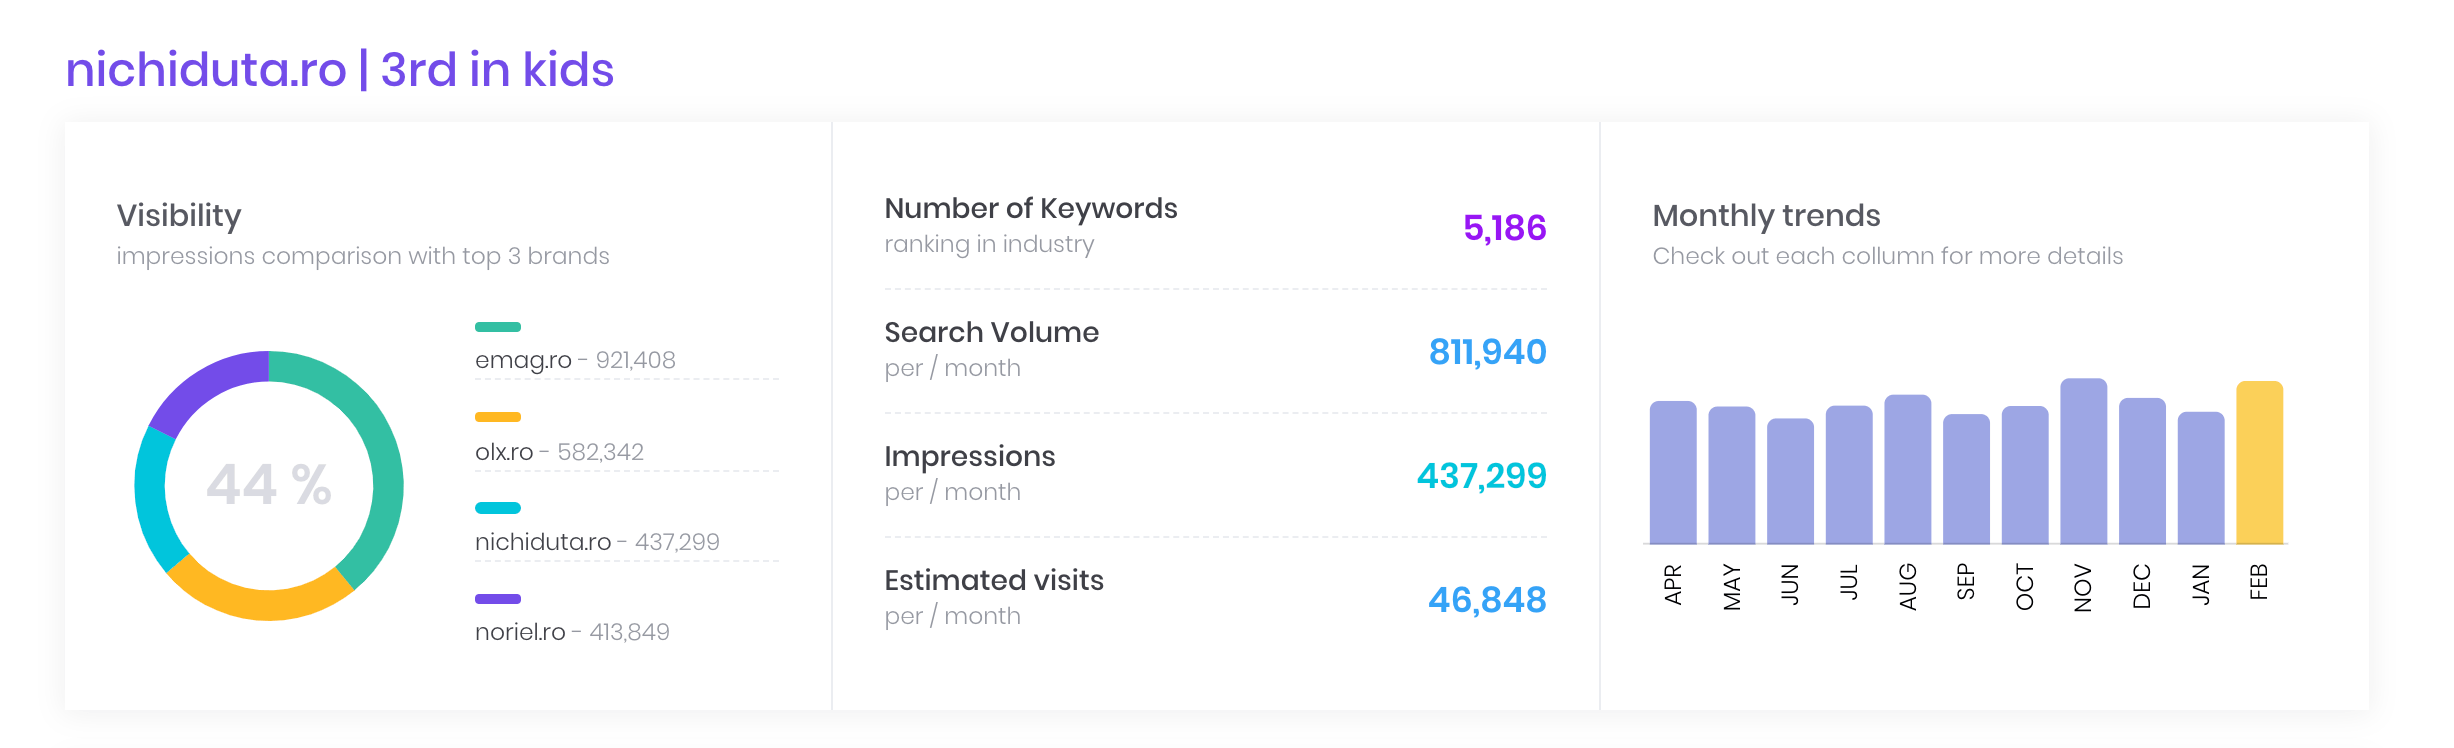
In the upper left corner of the profile page that corresponds to your site you can see what your organic visibility is, but also of the 3 main competitors in the industry. It is calculated based on impressions and can be used for a correct and relevant comparison of your online position.
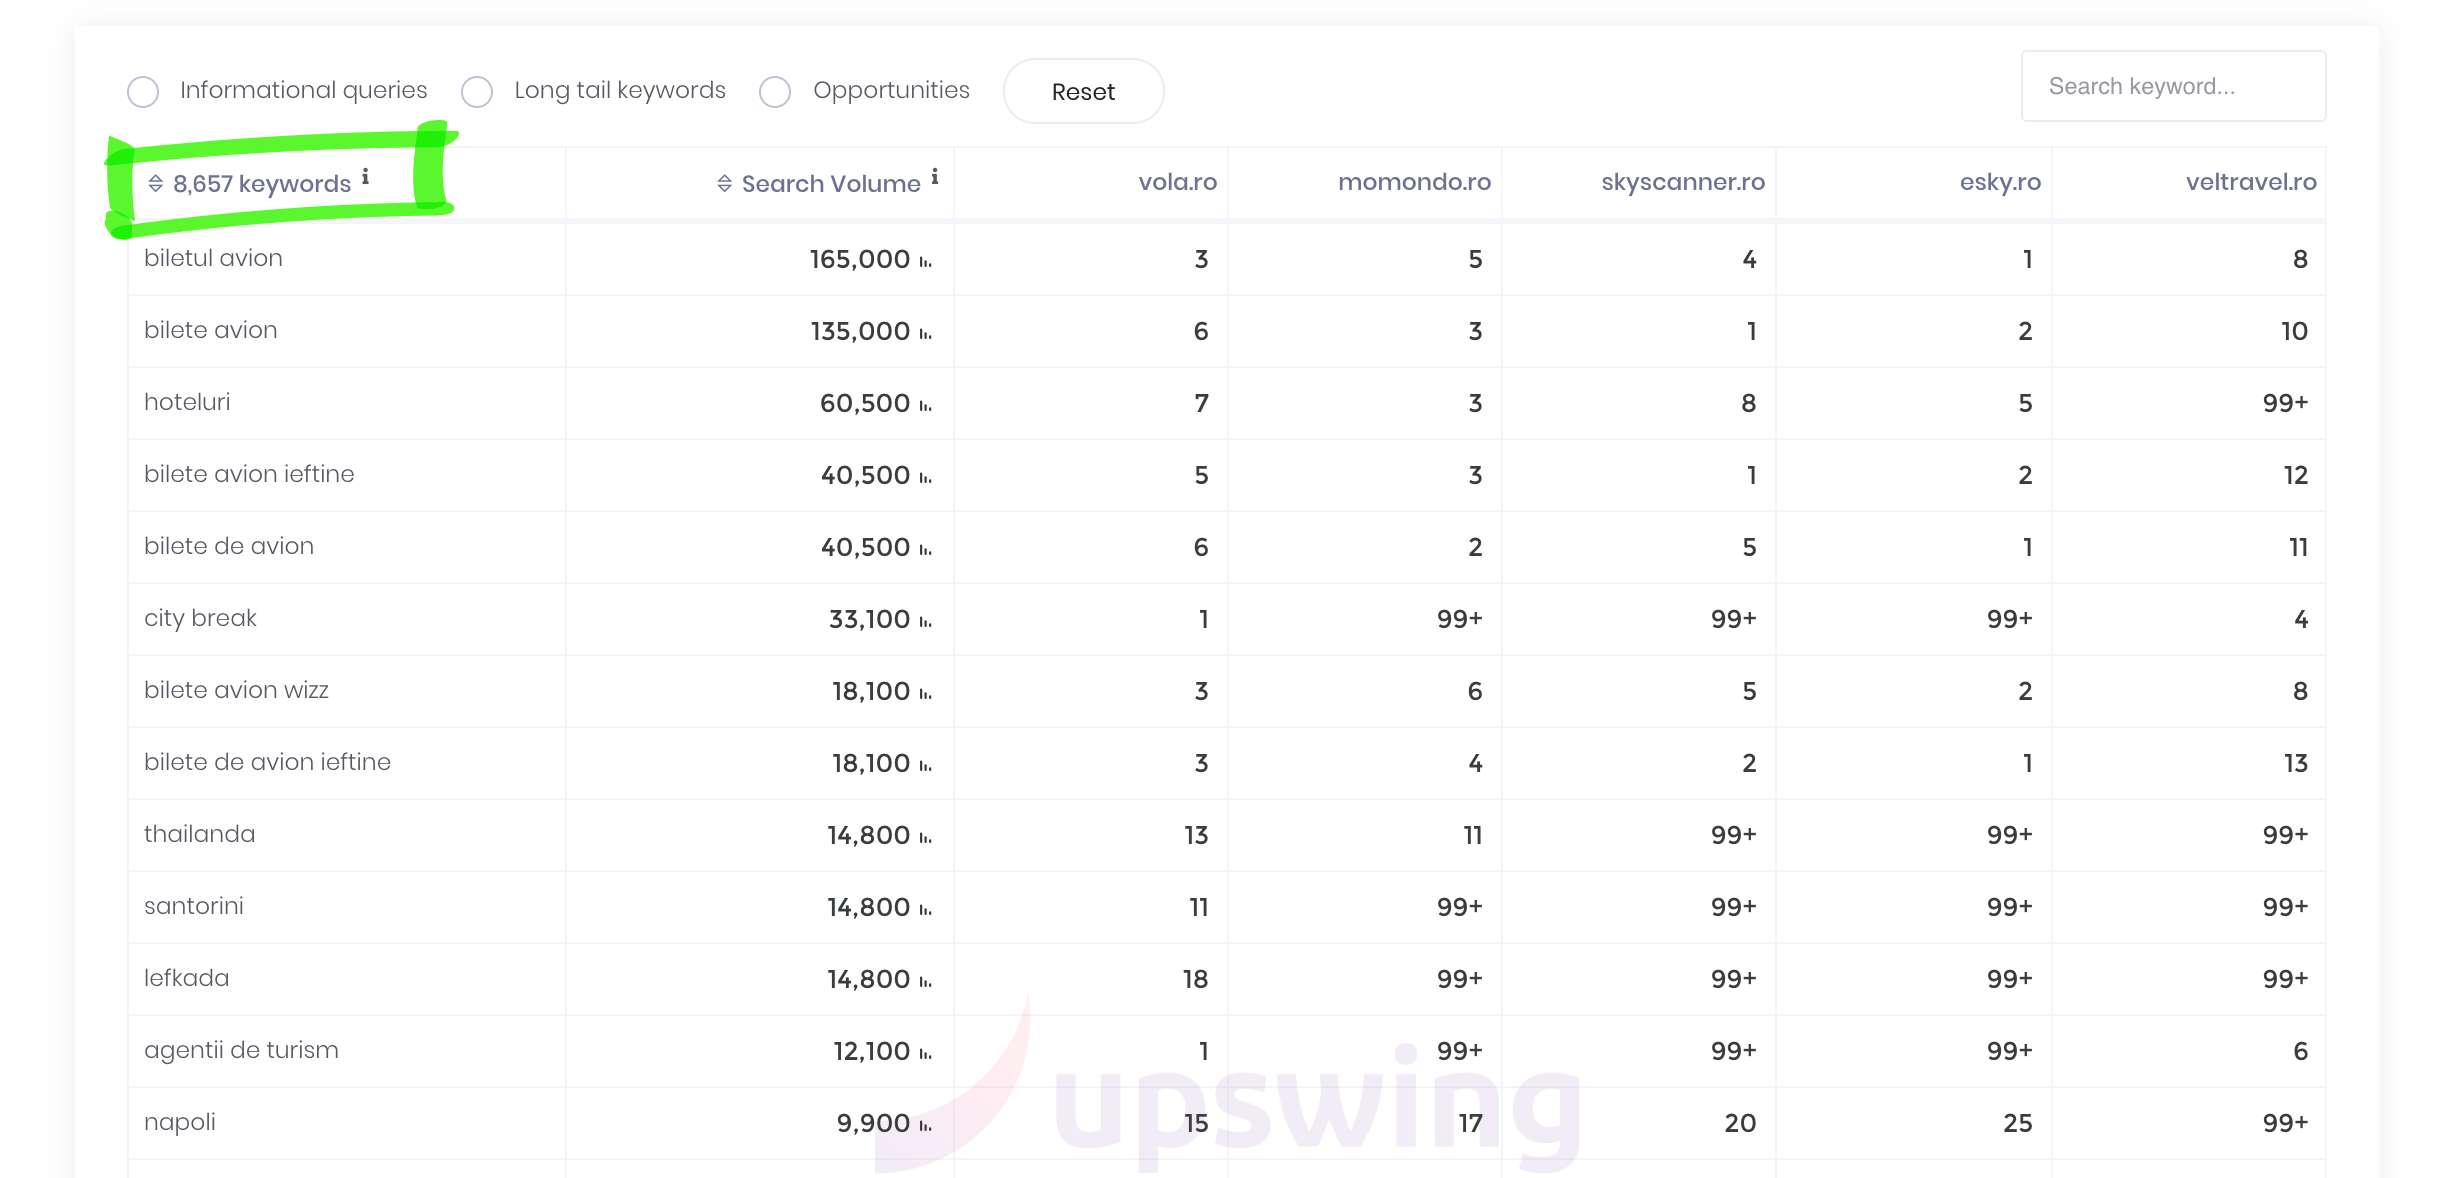
4. See the hierarchy of words in the industry by performance
Visibility Report will not only show you what all the words in an industry are – although it does, but it allows you to see their hierarchy by performance, so you can easily figure out what SEO and content marketing opportunities are.
5. You can analyze competitors based on the words that ensure their visibility
What are the words that drive traffic to your competitors? What are their secret weapons? Access the appropriate industry and enter the website profile of one of your competitors. Here you will see a list of all the words that bring them traffic, but also a summary of statistics on the number of keywords they rank, the monthly volume of searches, monthly impressions, but also the estimated monthly visits.
With this tool, you can make a comparison almost as accurate as if you had access to their Google Analytics account. And no, we didn’t break any rules to provide you with this data, we just used what we already knew about search engines.
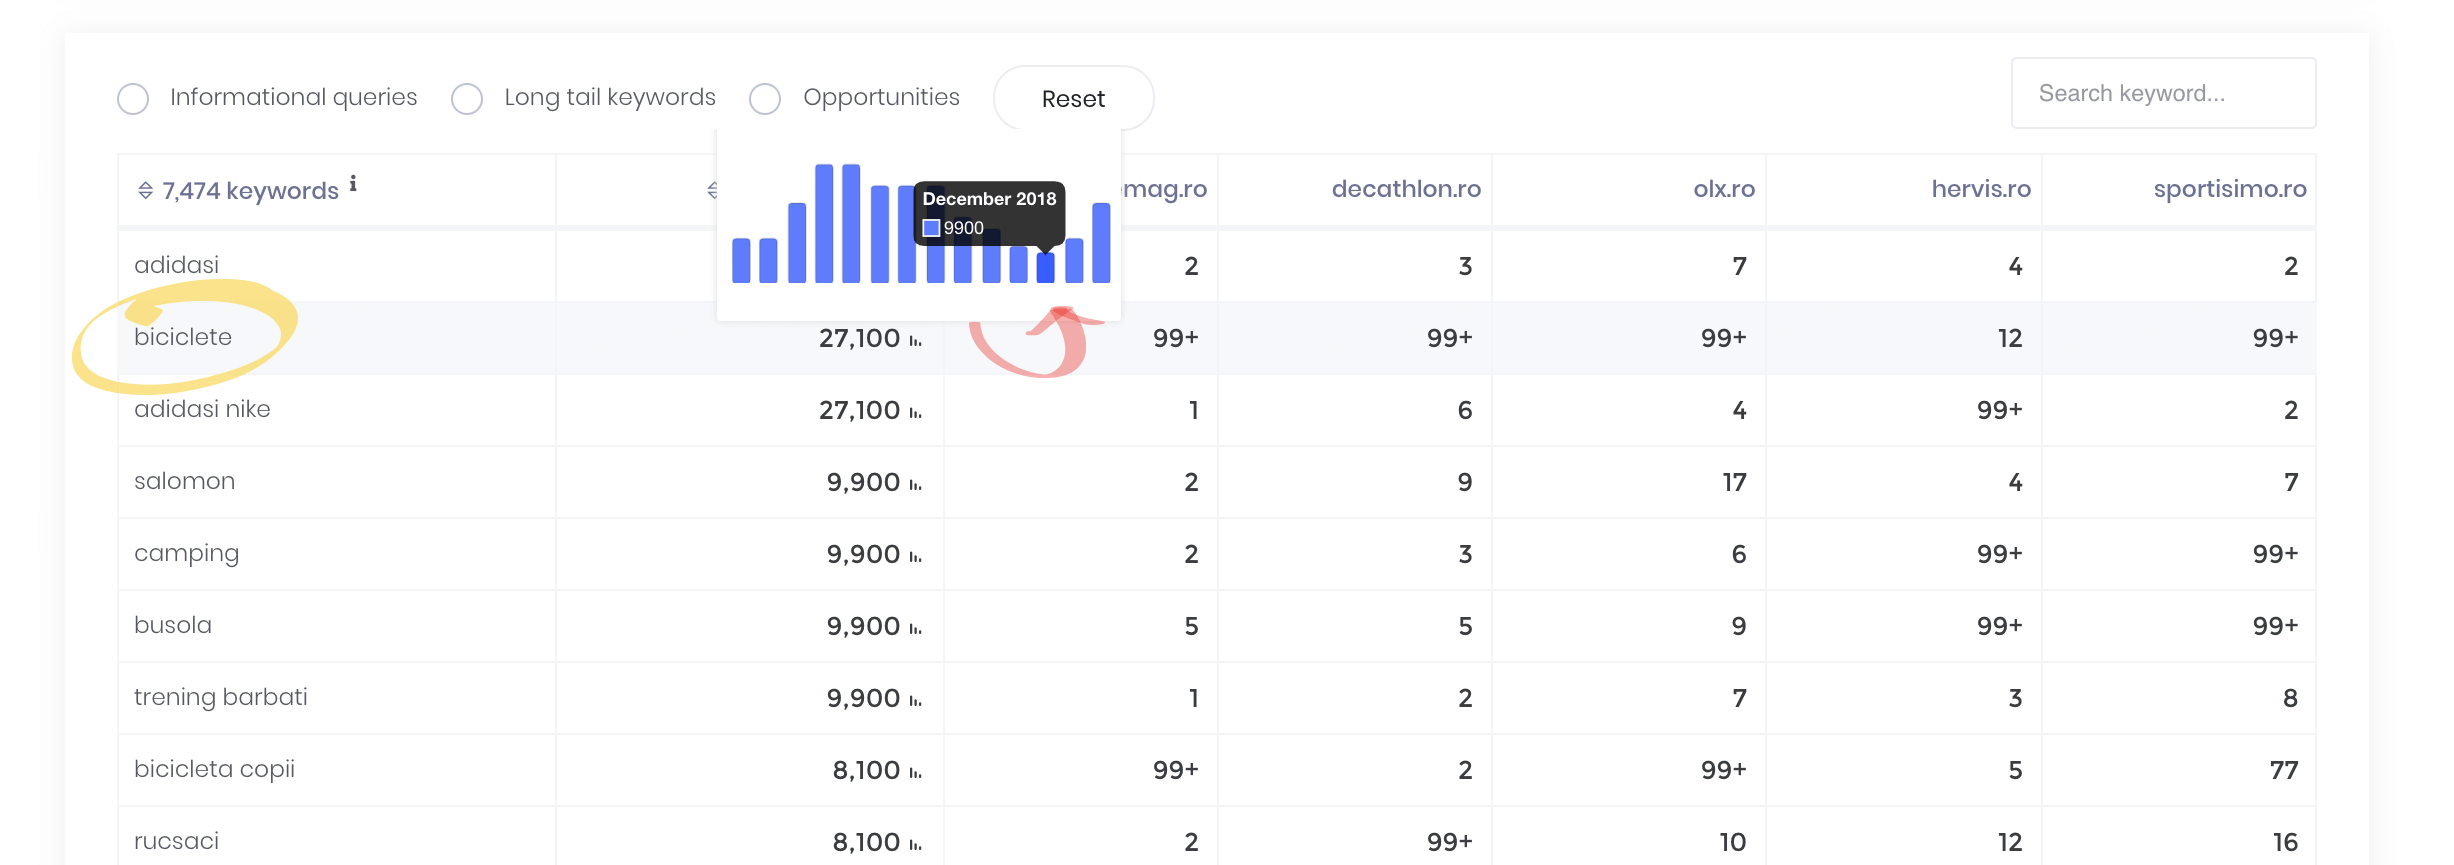
6. You can find out the seasonality of the industry you belong to
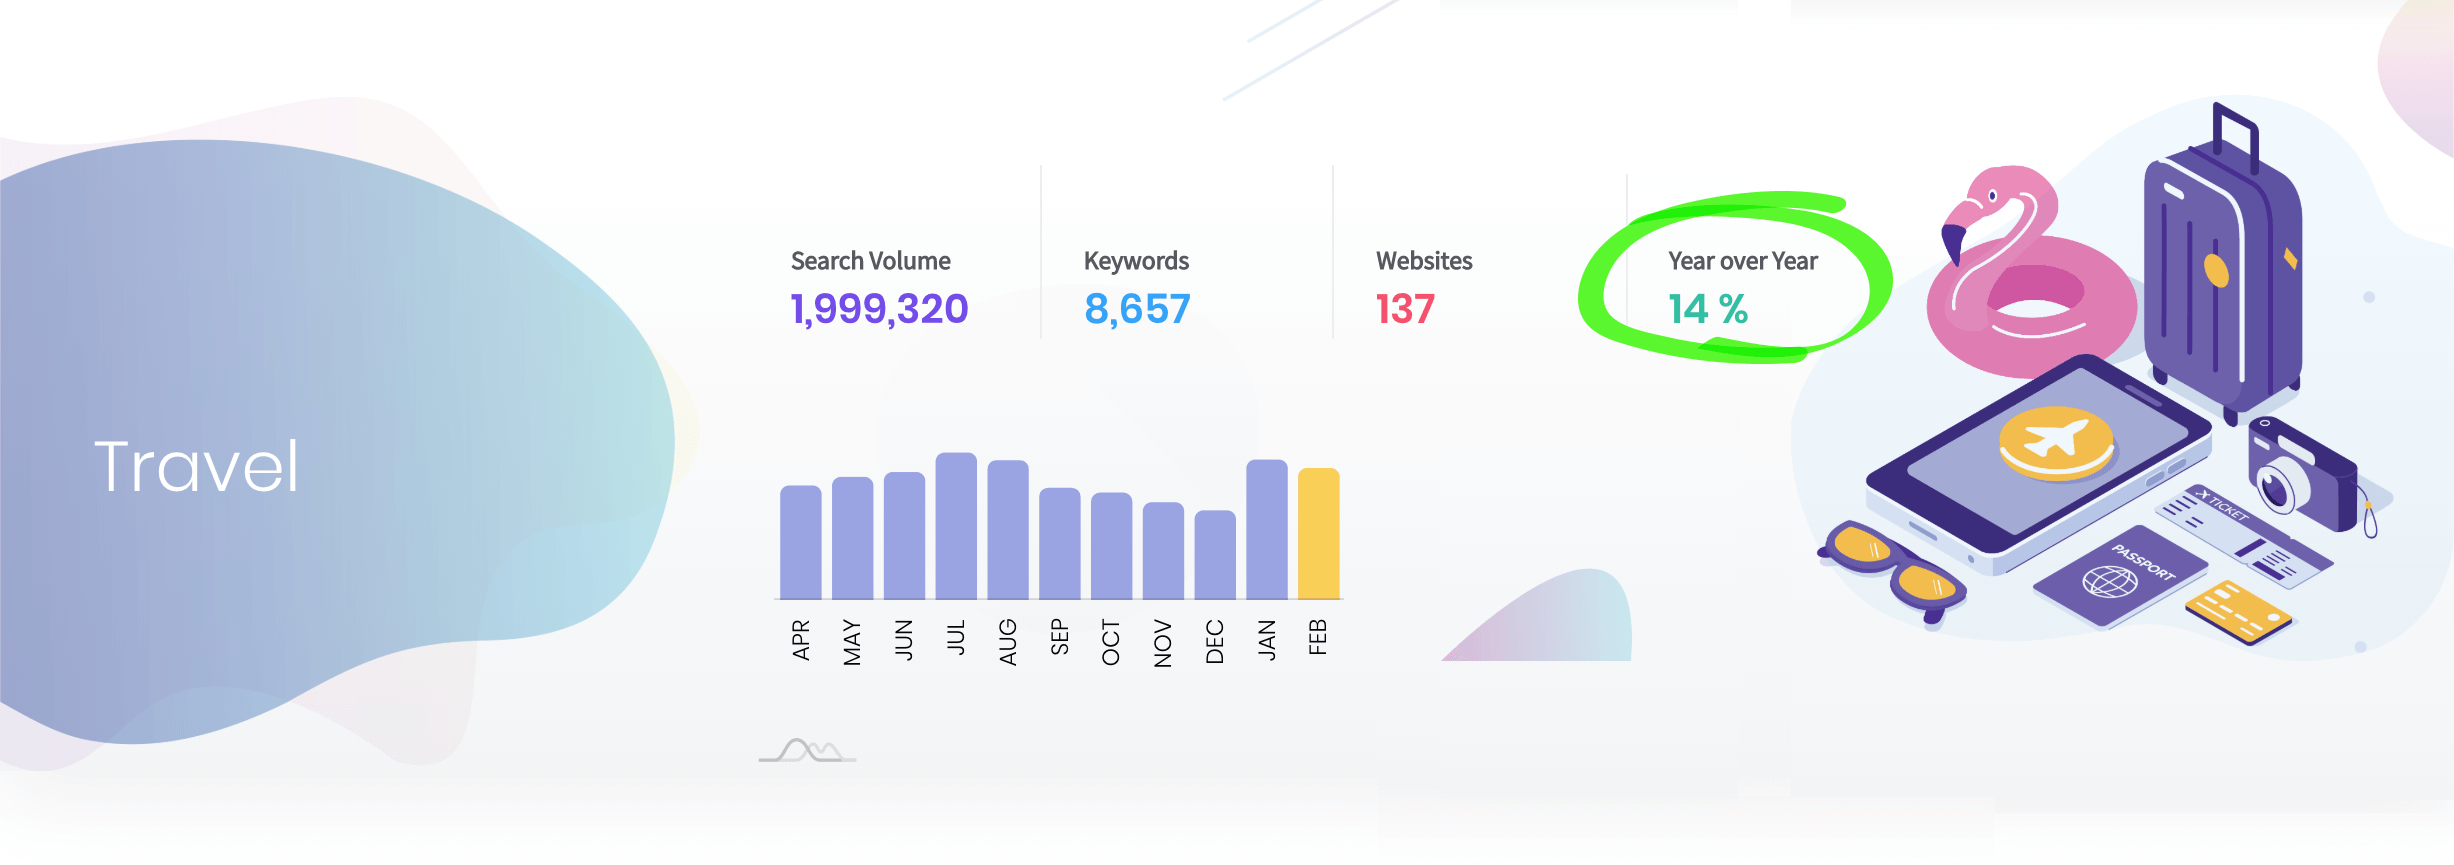
Of course, if you have an online florist, you know that the peak of sales will be reached every year, in March. But if you work in another industry, where seasonality is atypical and harder to guess, the report can help you get a clearer picture in this regard.
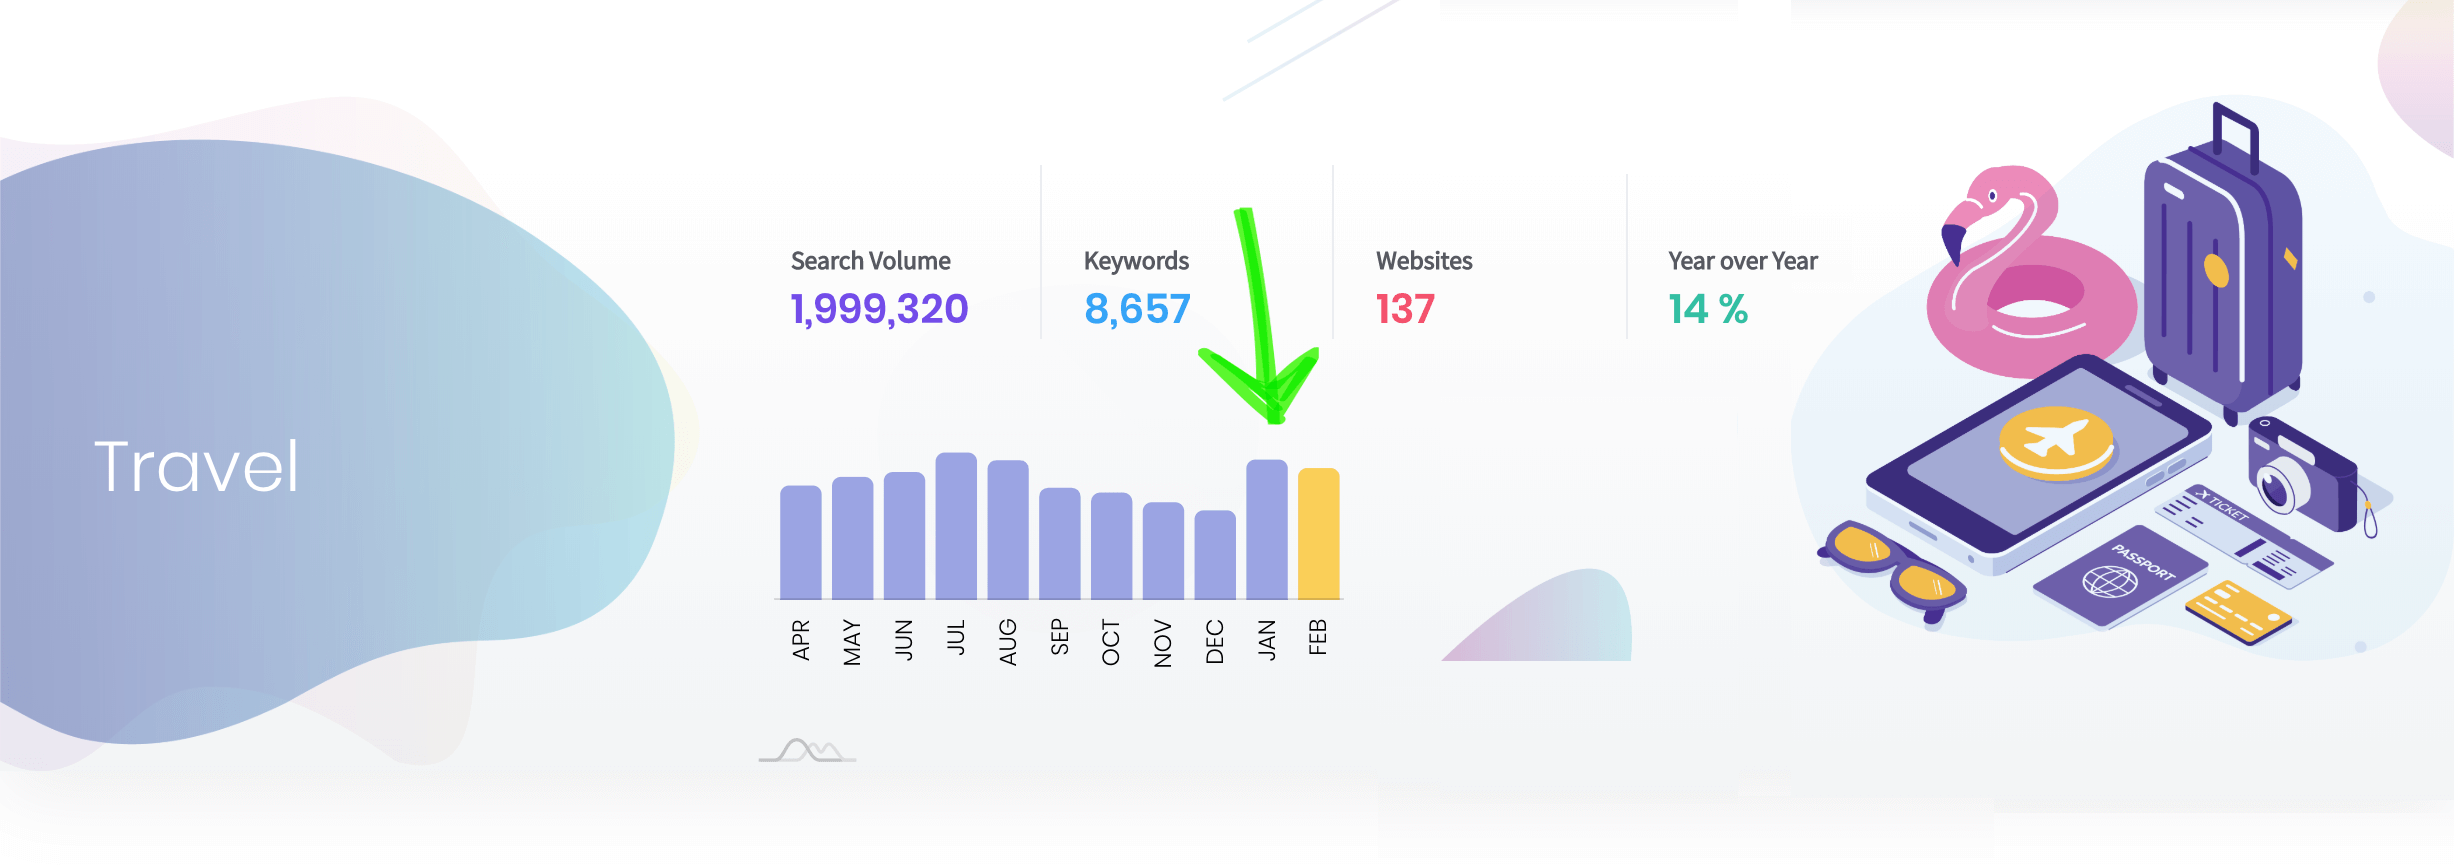
For example, in the travel category, January is in the top 3 searches, despite the fact that the period does not necessarily correspond to that of school holidays and holidays. However, many users are looking for holiday packages and plane tickets in January, thanks to the offers made after the holidays.
With the help of the report, you can have an overview of the seasonality of the industry, to find out if the decreases or increases of your site are related to this factor. You can analyze the seasonality of the keywords in the industry you belong to, in order to make a properly targeted campaign plan in advance, after which you can get an increase in sales.
You can also see the evolution of the industry from year to year, compared to the total volume of searches on relevant words.
7. You will discover new content opportunities
Long tail words that you have not targeted so far, but also other keywords with organic potential, which the competition does not rank, can offer you new opportunities in terms of content. You can find them all in the table of keywords in the industry and also here you can see which are the ones that do not position your competitors on the first page.
8. You can estimate the revenue of the competitors
You can use the data from the estimated visits section, as well as various industry benchmarks, such as the conversion rate and the average value of an order, to estimate the competition’s revenue from organic traffic. With the help of a computer like The Good, you will be able to estimate quite accurately what revenue your competitors have.
9. You easily realize what informational and transactional searches are and turn them into opportunities
Google searches can be informational or transactional. In the case of the first category, users seek information on the subject; they often contain terms such as “what is”, “how to”, “why”.
We can say that users who do such searches are in an early stage of the transaction process. And you can give them answers through specific content that will help them carry out their intentions. To see these searches, just use the Informational Queries filter when looking at industry keywords.
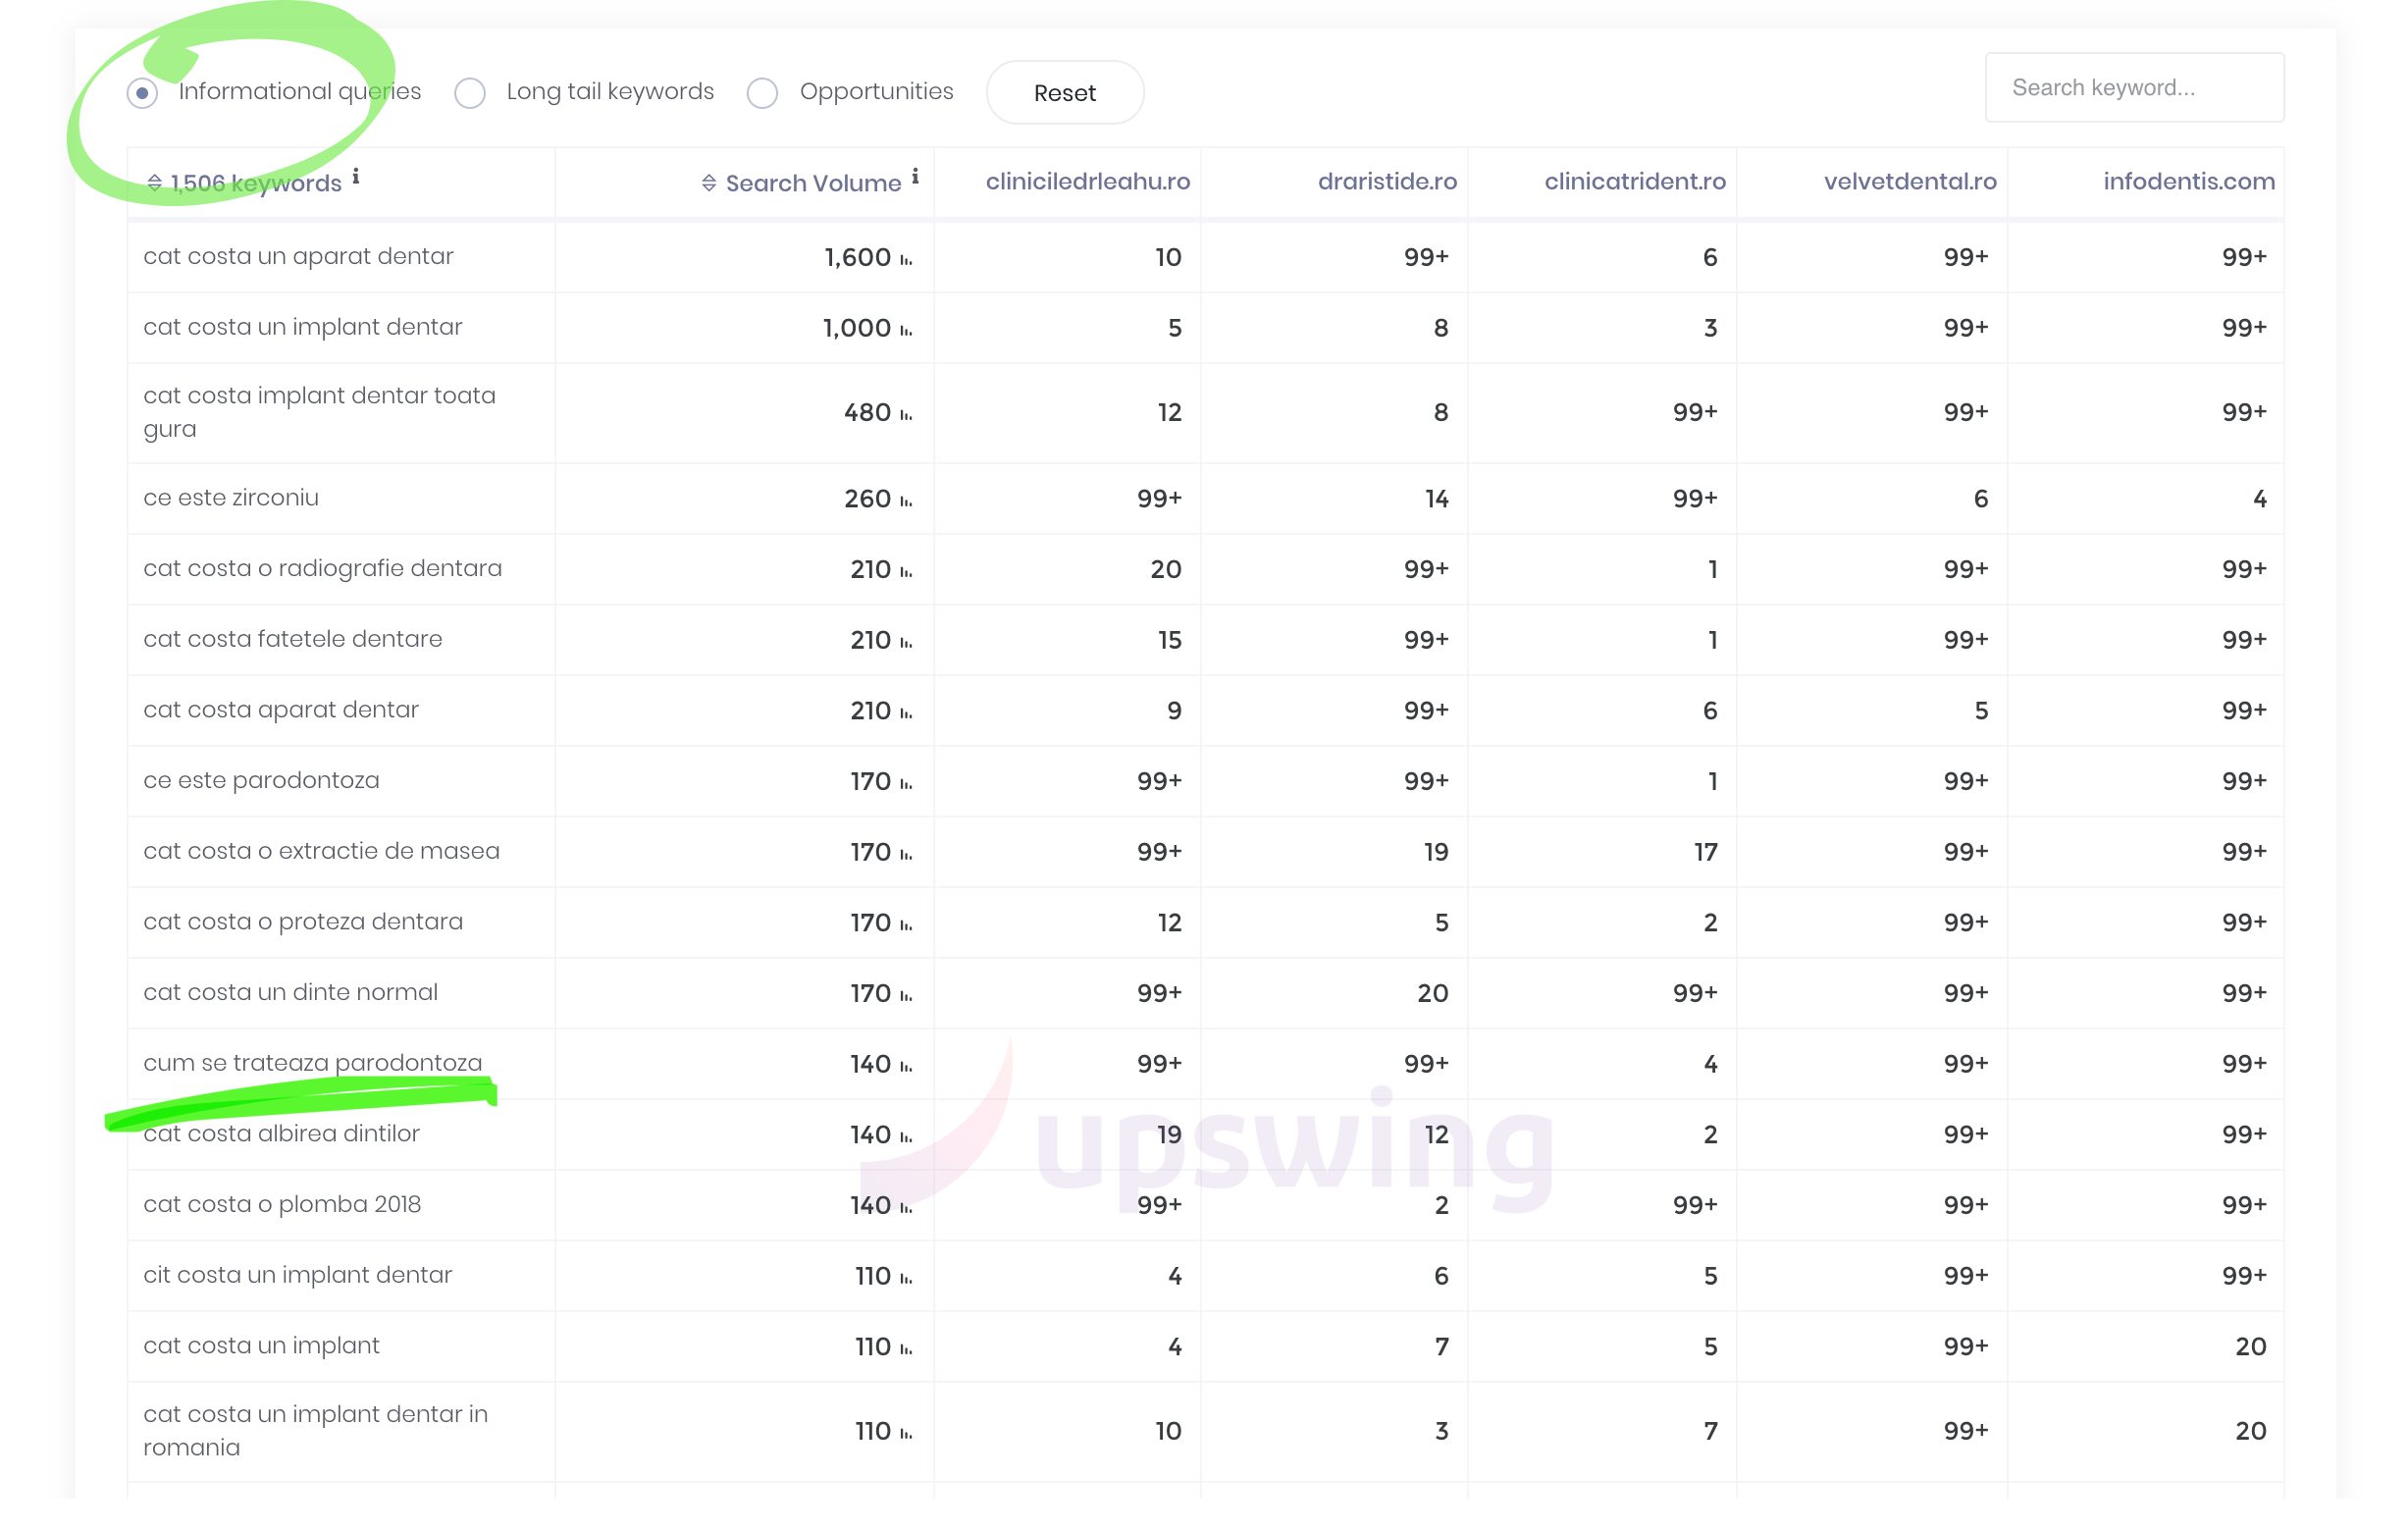
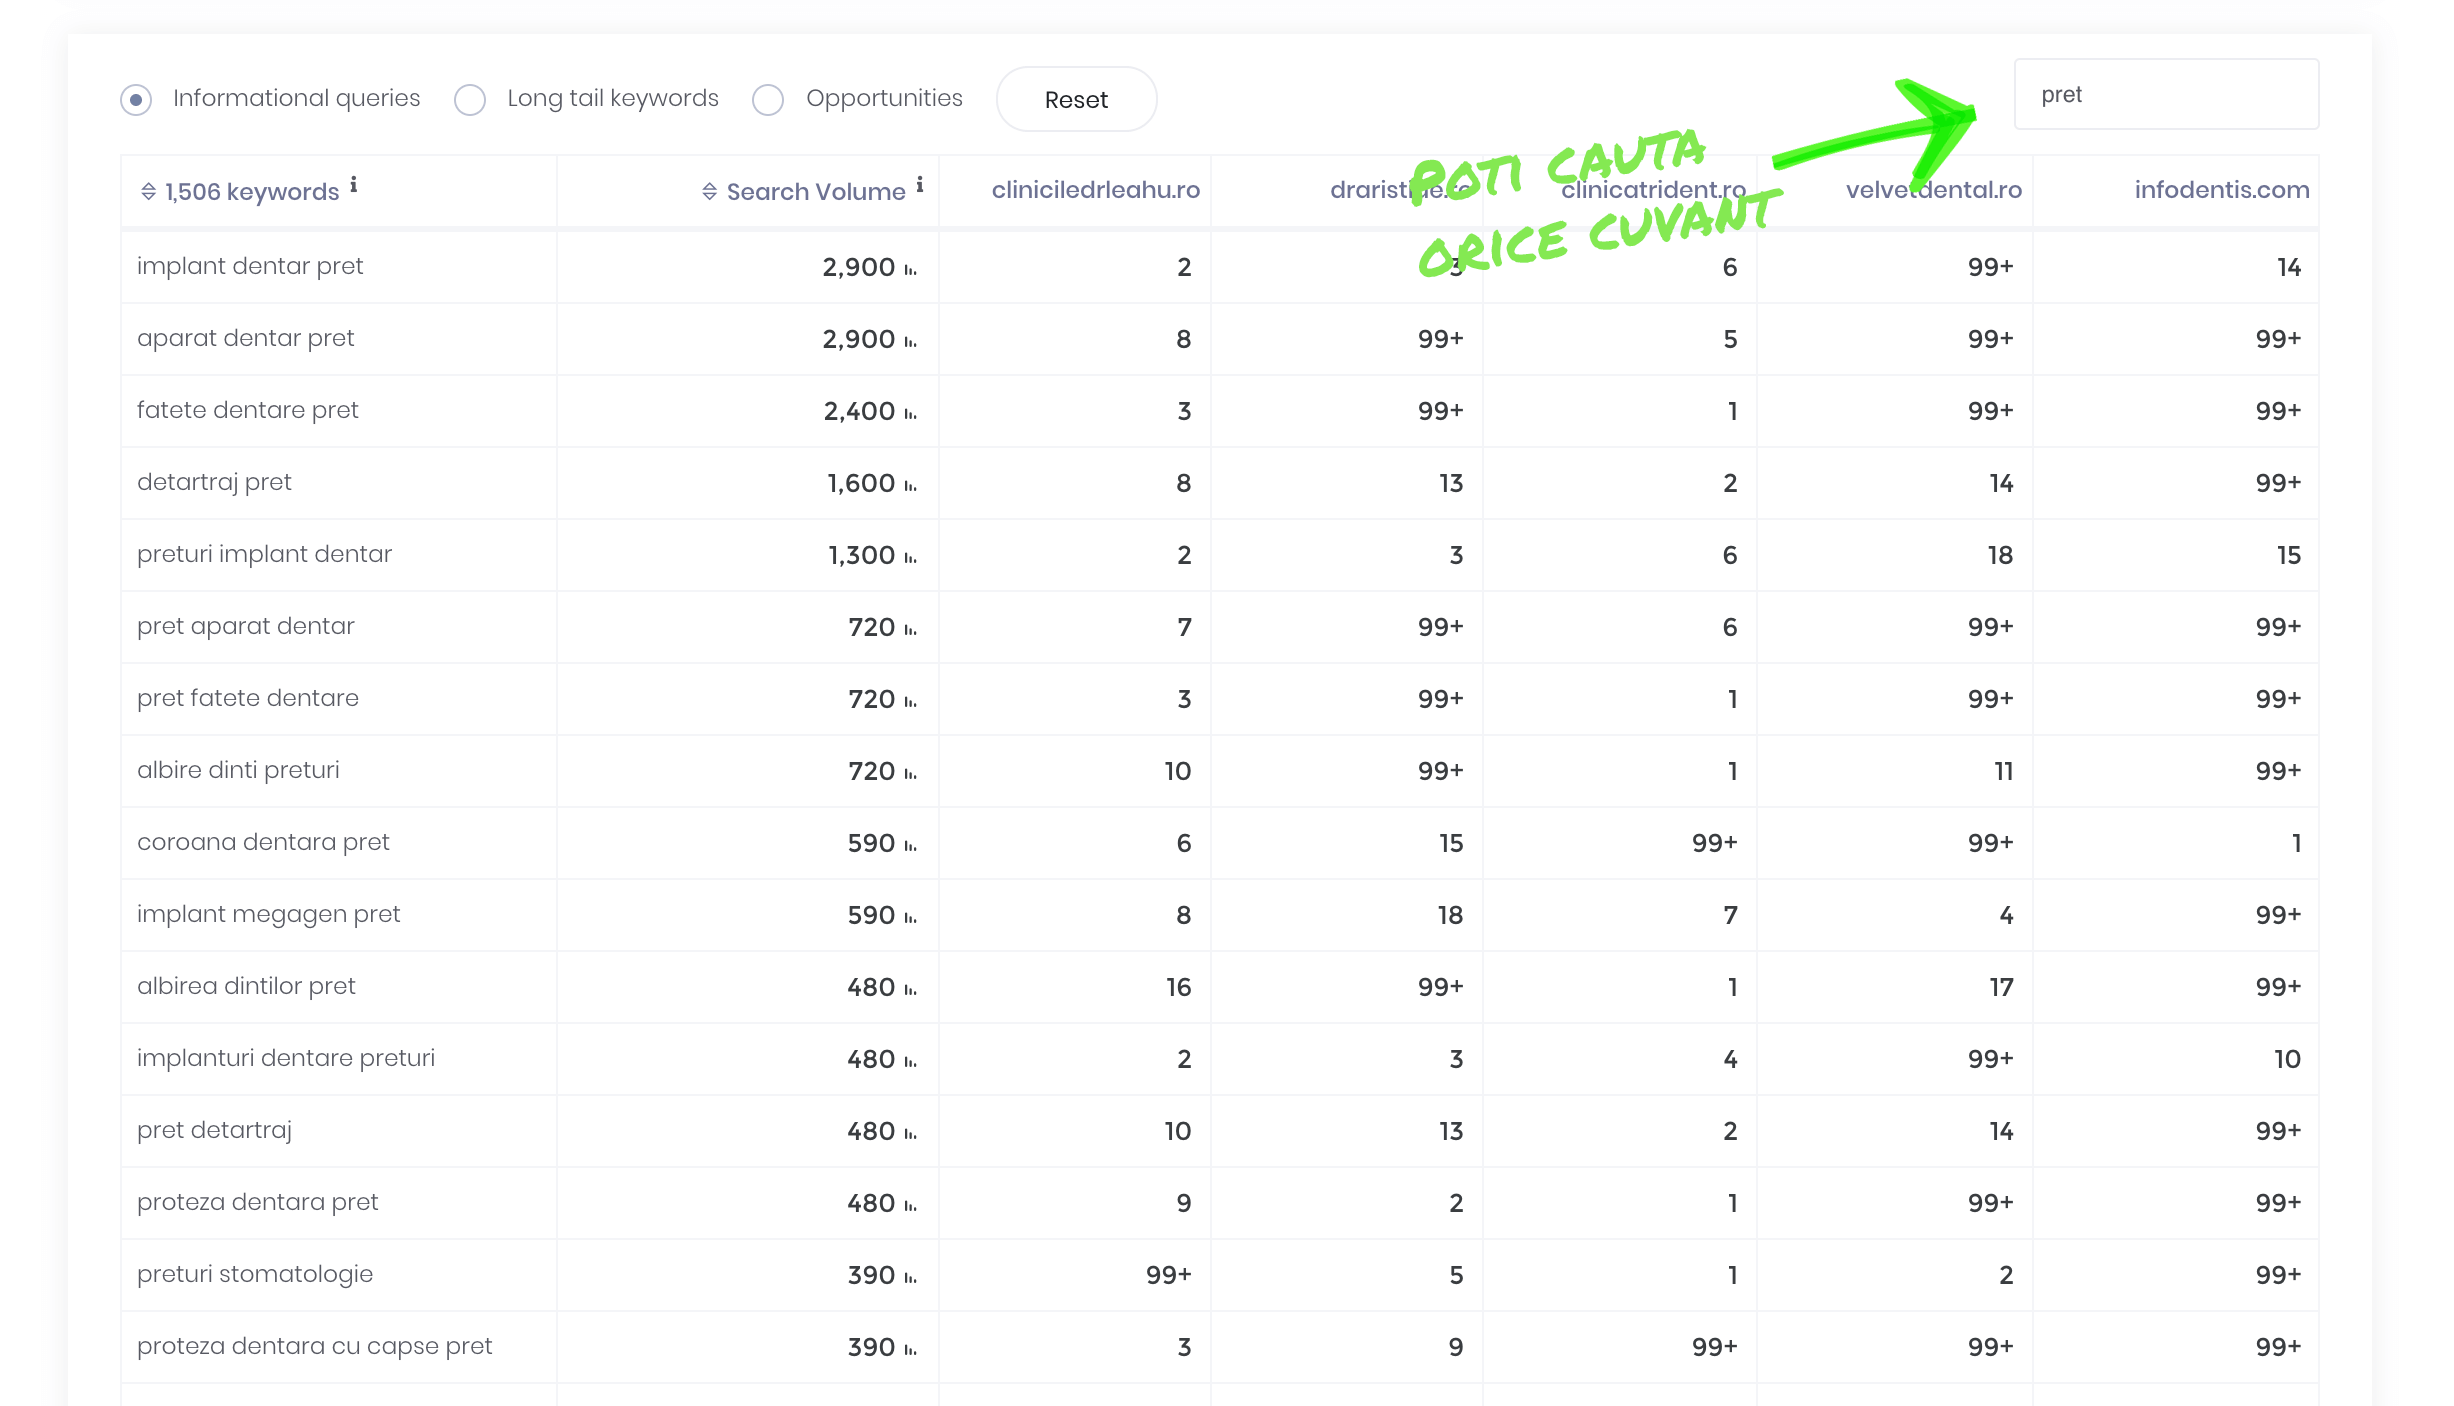
You can use this feature to fully satisfy the intentions of users, answering all questions related to a topic. You’ll see all searches associated with a term when you enter it in the search bar in the Visibility Report.
Let’s talk a little about transactional searches. In their case, users have the specific intention to buy. This means that they are in a position to generate conversions if they reach your site. Usually, these searches include the name of the desired product and terms such as “price”, “purchase”, “order”. These searches are the ones that can bring you sales, if your page is optimized so that it meets the purchase intention.
You have a precious tool at your disposal. Sure, you’re not the only one, but you’re one of the first. How are you going to use Visibility Report and get what you want with it?